


Highlights
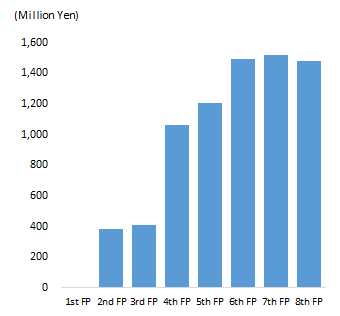
Operating Revenue
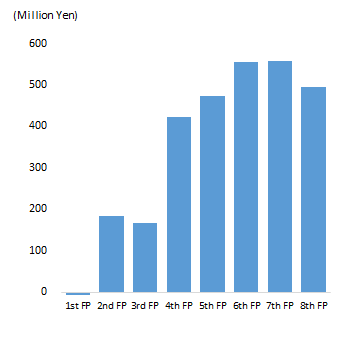
Operating Profit
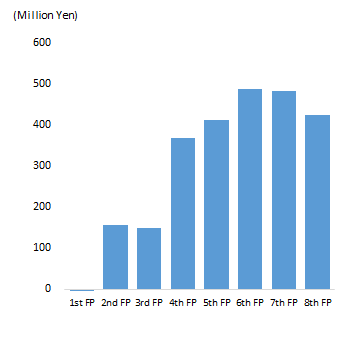
Net Profit
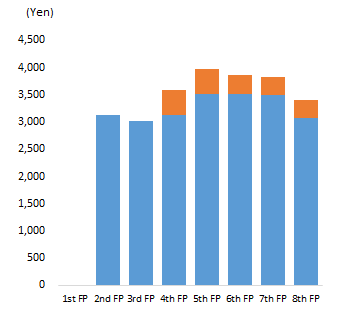
Dividend per Units
| 1st FP | 2nd FP | 3rd FP | 4th FP | 5th FP | 6th FP | 7th FP | 8th FP | ||
|---|---|---|---|---|---|---|---|---|---|
| Operating Revenue(Million JPY) | ー | 382 | 409 | 1,062 | 1,205 | 1,493 | 1,517 | 1,476 | |
| Operating Profit(Million JPY) | △6 | 183 | 168 | 422 | 473 | 555 | 557 | 495 | |
| Current Profit(Million JPY) | △6 | 161 | 149 | 369 | 415 | 488 | 484 | 426 | |
| Net Profit(Million JPY) | △4 | 158 | 149 | 368 | 414 | 487 | 483 | 425 | |
| Dividend per Unit(JPY) | 0 | 3,121 | 3,021 | 3,586 | 3,976 | 3,871 | 3,826 | 3,397 | |
| Total Assets(Million JPY) | 222 | 9,041 | 8,915 | 23,071 | 24,538 | 29,334 | 28,849 | 28,903 | |
| Net Assets(Million JPY) | 195 | 4,589 | 4,854 | 11,331 | 11,322 | 13,571 | 13,519 | 13,414 | |
| Net Assets to Total Assets(%) | 88.0 | 53.7 | 54.5 | 49.1 | 46.1 | 46.3 | 46.9 | 46.4 | |
| Net Assets per Units(JPY) | 97,748 | 98,323 | 98,223 | 96,050 | 96,050 | 97,939 | 97,560 | 96,803 |
| Operating Revenue(Million JPY) | Operating Profit(Million JPY) | Current Profit(Million JPY) | Net Profit(Million JPY) | Dividend per Unit(JPY) | Total Assets(Million JPY) | Net Assets(Million JPY) | Net Assets to Total Assets(%) | Net Assets per Units(JPY) | FP | Operating Revenue(Million JPY) | Operating Profit(Million JPY) | Current Profit(Million JPY) | Net Profit(Million JPY) | Dividend per Unit(JPY) | Total Assets(Million JPY) | Net Assets(Million JPY) | Net Assets to Total Assets(%) | Net Assets per Units(JPY) | FP | Operating Revenue(Million JPY) | Operating Profit(Million JPY) | Current Profit(Million JPY) | Net Profit(Million JPY) | Dividend per Unit(JPY) | Total Assets(Million JPY) | Net Assets(Million JPY) | Net Assets to Total Assets(%) | Net Assets per Units(JPY) | FP | Operating Revenue(Million JPY) | Operating Profit(Million JPY) | Current Profit(Million JPY) | Net Profit(Million JPY) | Dividend per Unit(JPY) | Total Assets(Million JPY) | Net Assets(Million JPY) | Net Assets to Total Assets(%) | Net Assets per Units(JPY) | FP | Operating Revenue(Million JPY) | Operating Profit(Million JPY) | Current Profit(Million JPY) | Net Profit(Million JPY) | Dividend per Unit(JPY) | Total Assets(Million JPY) | Net Assets(Million JPY) | Net Assets to Total Assets(%) | Net Assets per Units(JPY) | FP | Operating Revenue(Million JPY) | Operating Profit(Million JPY) | Current Profit(Million JPY) | Net Profit(Million JPY) | Dividend per Unit(JPY) | Total Assets(Million JPY) | Net Assets(Million JPY) | Net Assets to Total Assets(%) | Net Assets per Units(JPY) | |||||||||||
|---|---|---|---|---|---|---|---|---|---|---|---|---|---|---|---|---|---|---|---|---|---|---|---|---|---|---|---|---|---|---|---|---|---|---|---|---|---|---|---|---|---|---|---|---|---|---|---|---|---|---|---|---|---|---|---|---|---|---|---|---|---|---|---|---|---|---|---|---|---|
| 1st FP | ー | △6 | △6 | △4 | 0 | 222 | 195 | 88.0 | 97,748 | ||||||||||||||||||||||||||||||||||||||||||||||||||||||||||||
| 2nd FP | 382 | 183 | 161 | 158 | 3,121 | 9,041 | 4,589 | 53.7 | 98,323 | ||||||||||||||||||||||||||||||||||||||||||||||||||||||||||||
| 3rd FP | 409 | 168 | 149 | 149 | 3,021 | 8,915 | 4,854 | 54.5 | 98,223 | ||||||||||||||||||||||||||||||||||||||||||||||||||||||||||||
| 4th FP | 1,062 | 422 | 369 | 368 | 3,586 | 23,071 | 11,331 | 49.1 | 96,050 | ||||||||||||||||||||||||||||||||||||||||||||||||||||||||||||
| 5th FP | 1,205 | 473 | 415 | 414 | 3,976 | 24,538 | 11,322 | 46.1 | 95,976 | ||||||||||||||||||||||||||||||||||||||||||||||||||||||||||||
| 6th FP | 1,493 | 555 | 488 | 487 | 3,871 | 29,334 | 13,571 | 46.3 | 97,939 | ||||||||||||||||||||||||||||||||||||||||||||||||||||||||||||
| 7th FP | 1,517 | 557 | 484 | 483 | 3,826 | 28,849 | 13,519 | 46.9 | 97,560 | ||||||||||||||||||||||||||||||||||||||||||||||||||||||||||||
| 8th FP | 1,476 | 495 | 426 | 425 | 3,397 | 28,903 | 13,414 | 46.4 | 96,803 | ||||||||||||||||||||||||||||||||||||||||||||||||||||||||||||